A Visual Guide to Transformations: the Salesforce Data Model
Data transformation is an essential step in data integration. It's the process by which raw data is cleansed and manipulated to get to a usable analysis-ready state. Transformations can join different data sets, remove duplicate records, filter out data, make calculations to change data and time formats, and more. It's hugely valuable because without transformations, companies lack the ability to convert data into meaningful insights that influence critical business decisions.
Fivetran Data Models are off-the-shelf tools that allow data analysts or data engineers to effortlessly transform raw data from common sources into data models for reports and dashboards. This saves analysts considerable time and effort.
Many companies today depend on data in Salesforce to get a deeper understanding of their customer base. The customer relationship management (CRM) platform unites marketing, sales, commerce, and service functions with a wide range of products and services to sell smarter and market more effectively. As a result, Salesforce data sets are often large and complex. In this blog, we walk through creating a running snapshot of a sales team’s performance using the Fivetran data model for Salesforce.
The data model for Salesforce allows you to read from the following raw tables from the Salesforce API [1]:
- account: current and potential customers
- user: salespeople and their managers
- opportunity: deals in progress
- user role: a reference list of manager positions
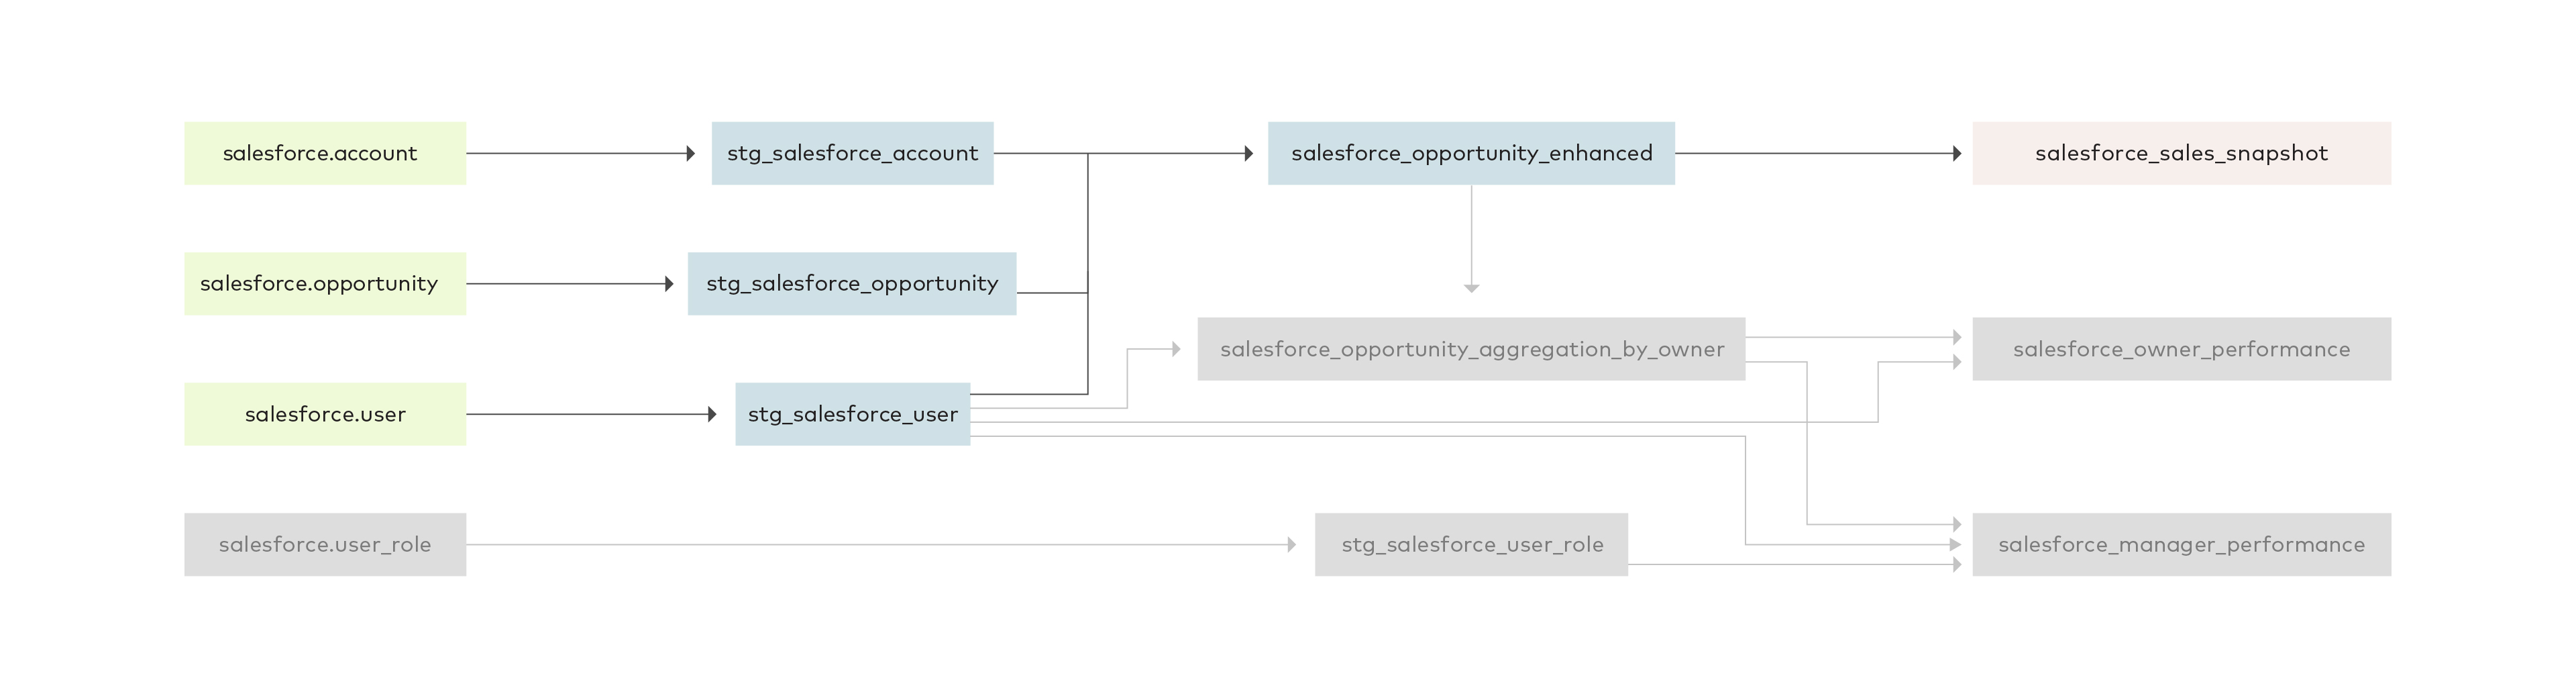
The raw tables are ultimately turned into the following finished data models [2]:
- sales snapshot: a summary of performance in the last month and quarter in terms of bookings, pipeline, losses, and win rates
- owner performance: bookings, pipeline, losses, and win rates by individual salesperson
- manager performance: bookings, pipeline, losses, and win rates by manager
- opportunity enhanced: an opportunity enriched with related data about the account and opportunity owner.
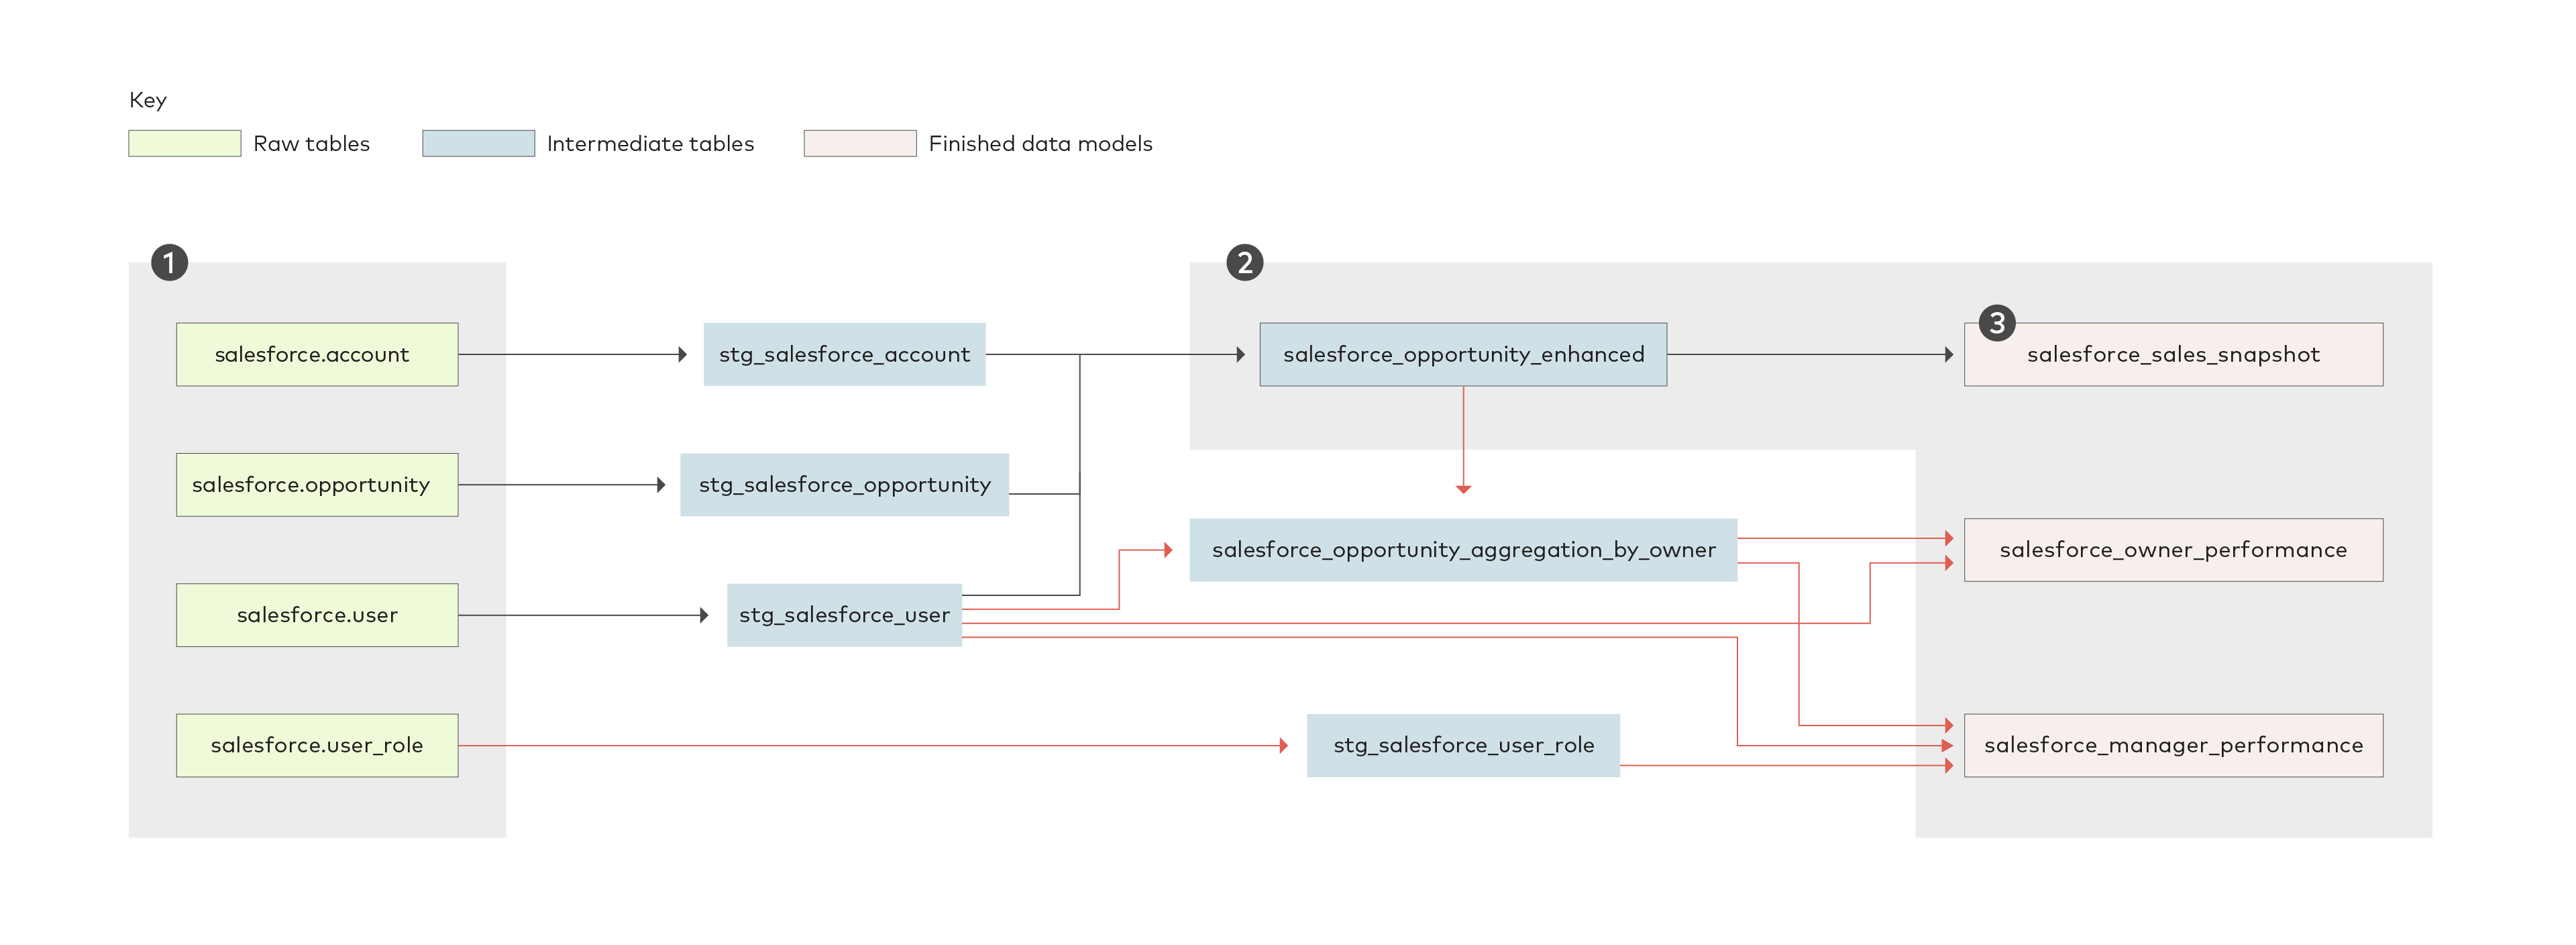
Let’s discuss in detail the steps it takes to produce the sales snapshot [3] data model, which summarizes bookings, pipeline, losses, and wins in the last month and quarter.
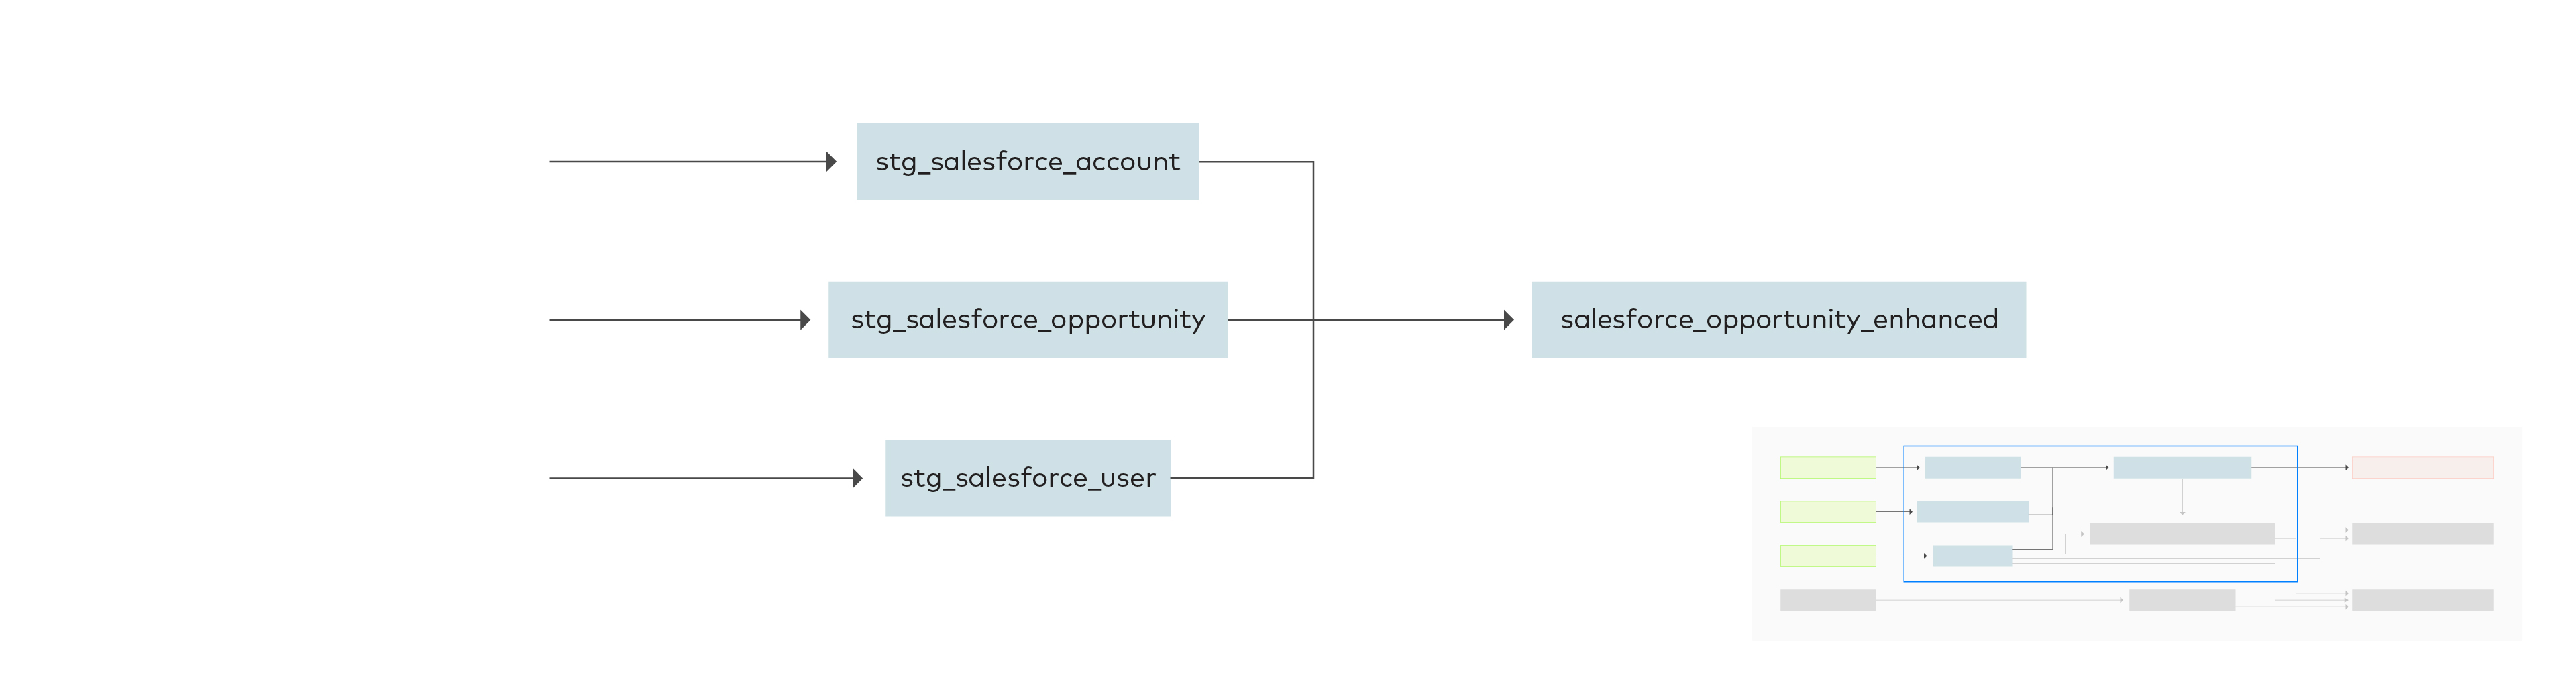
The opportunity, account and user tables are used to produce the sales snapshot model, with opportunity enhanced as an intermediate step. Strictly speaking, account and user aren’t necessary to construct the sales snapshot model, but are necessary to construct the owner performance and manager performance models.
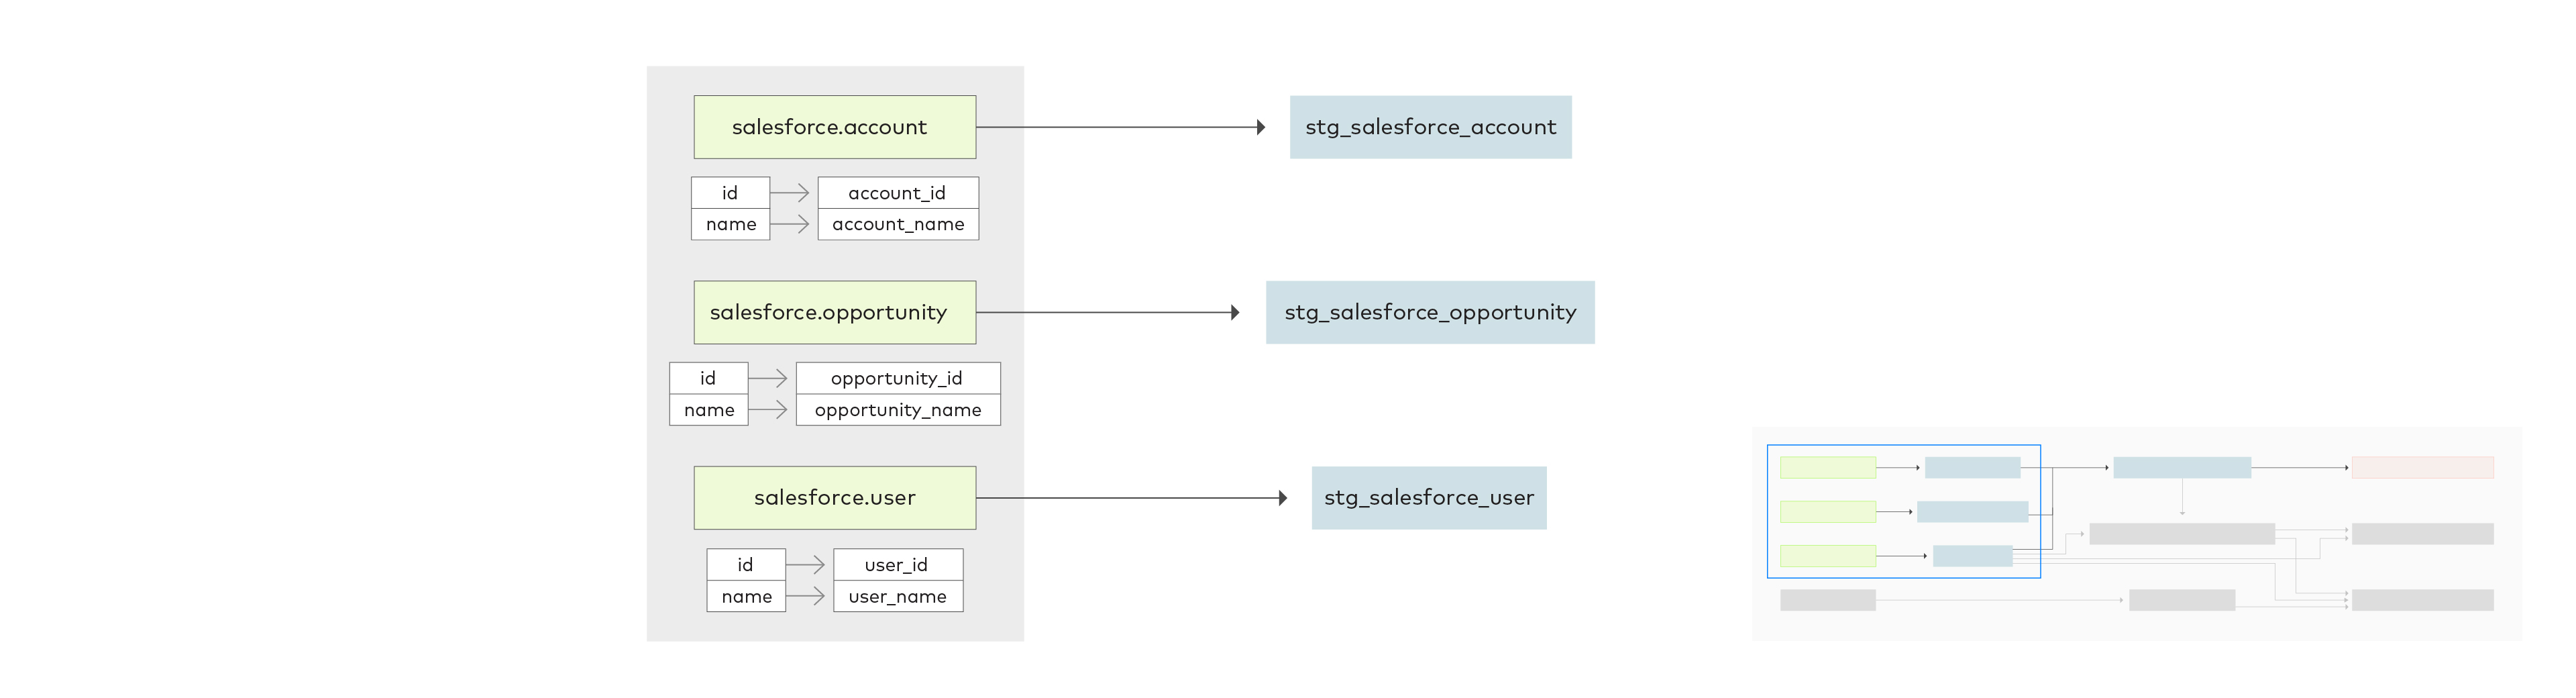
The first step in the sequence of transformations is staging the data in a format that will be easier to work with. For each raw data table, the id and name columns are renamed to be unique to avoid confusion when working with columns from all three tables. This prevents duplicate columns between tables, making the joined table easier to interpret. The staging tables with renamed columns are prefixed by stg.
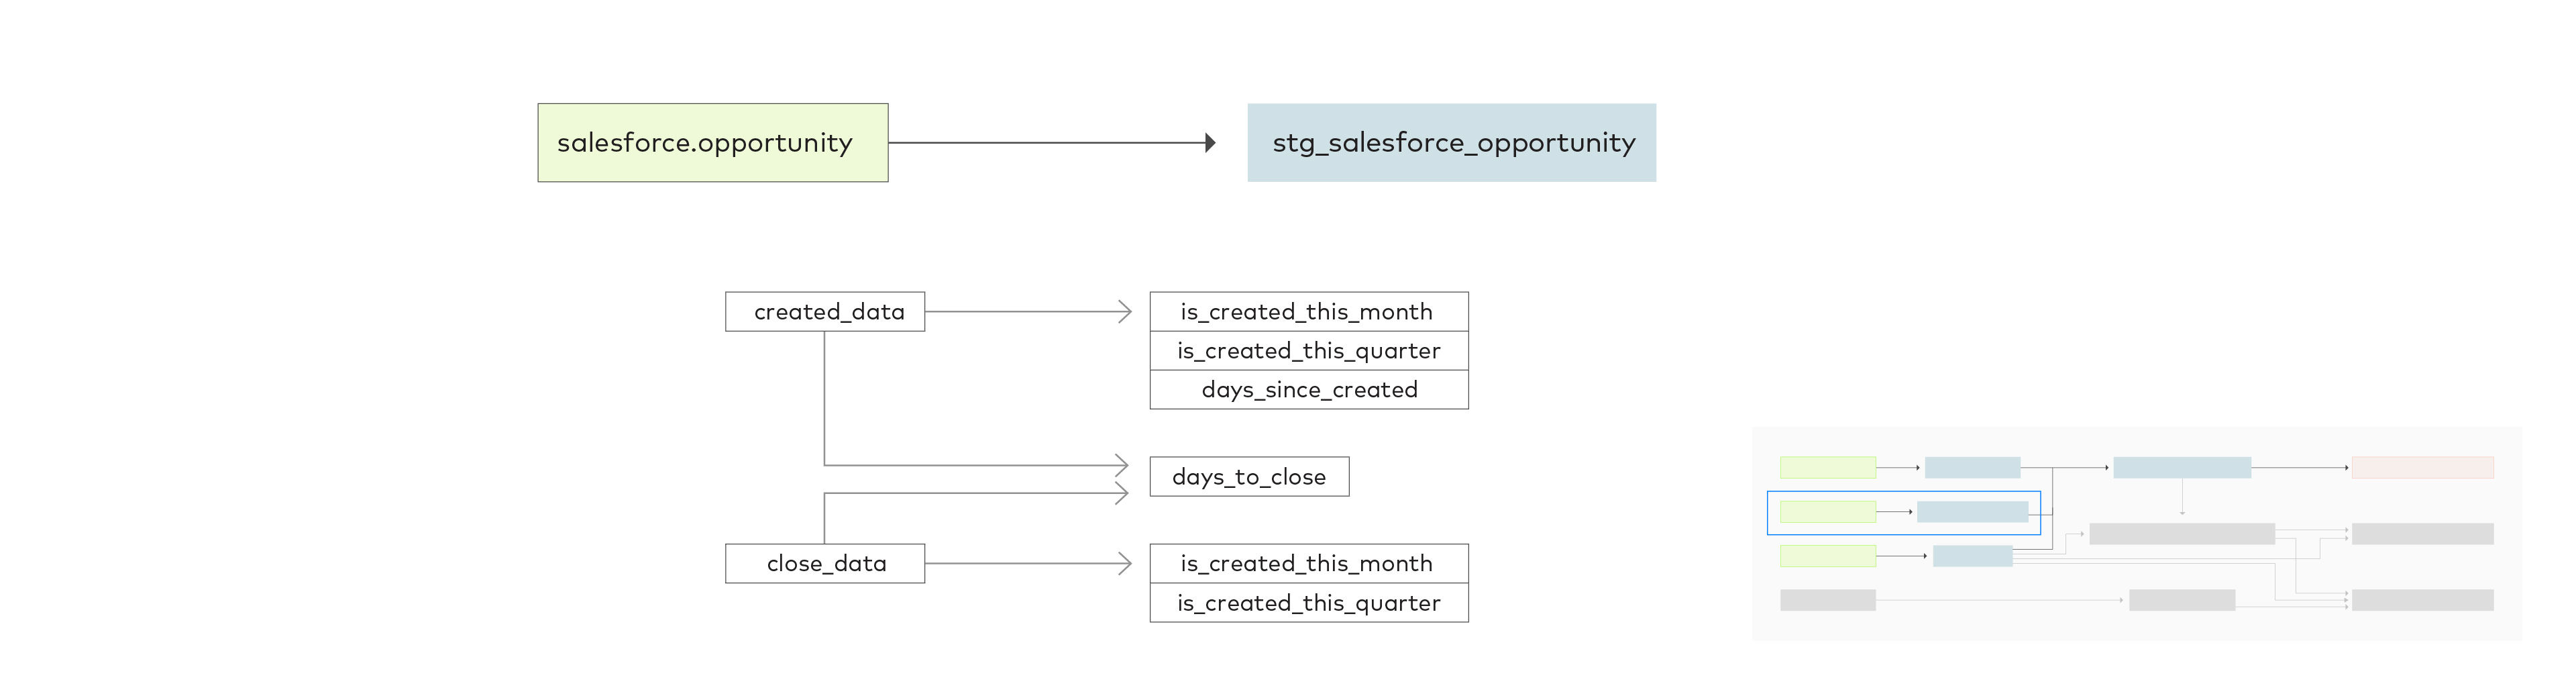
For the opportunity table, we also need to determine whether each opportunity was created and/or closed in the last month and quarter in order to create the snapshot. This will result in a number of new columns: is_created_this_month, is_created_this_quarter, days_since_created, days_to_close, is_closed_this_month and is_closed_this_quarter.
We need to compare created_date with the current date, month, and quarter to determine how old the opportunity is and if it was created in the current month and quarter, respectively.
The difference between created_date and close_date is how long the opportunity took to be closed.
close_date is compared with the current month and quarter to determine if the opportunity was closed in the current month and quarter, respectively.
The “staging” tables for `account` and `user` are joined to the staging table for `opportunity` using the `account_id` and `user_id` keys.
Each record from opportunity is assigned a status – “booking,” “pipeline,” “lost,” “won” and “other” – based on flags for is_won and is_closed and the designated category in forecast_category. For each opportunity, columns are also created for amounts and counts by quarter and month.
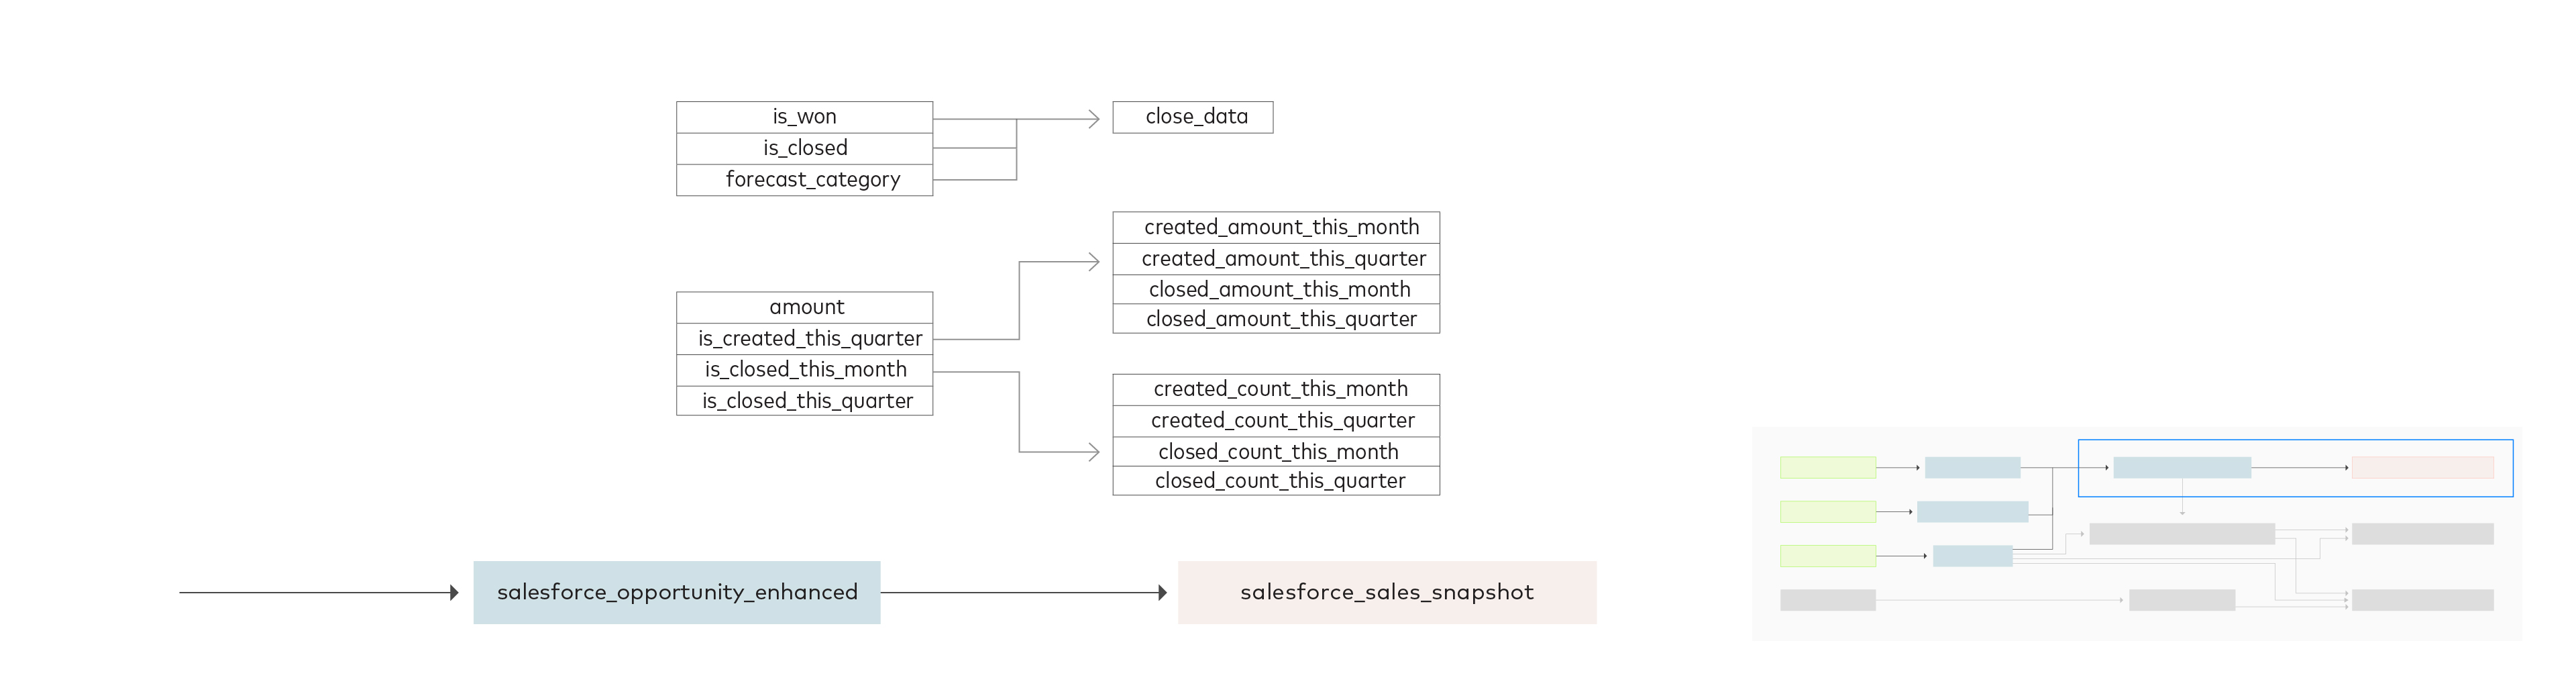
The final data model aggregates the data from `opportunity enhanced` by status. It has a number of fields that provide counts and amounts for the following sales statuses in the last month and quarter:
- Bookings
- Pipeline
- Lost
- Win %
These are created by joining together common table expressions derived from the `opportunity_enhanced` table on the basis of `status` values and from summing up closed and created figures.

The finished data model offers metrics you can use to produce a report or dashboard summarizing your sales team’s performance in the past month and quarter.
Fivetran’s data models are constantly being updated and refined. This Salesforce example is current as of January 2022 and does not by any means exhaustively represent the analysis that is possible using Salesforce data. Expect improvements to existing models and new models in the future!
Learn how to monitor pipelines, load data and trigger dbt models to transform data using Fivetran Transformations.


.svg)
.svg)
.svg)