Database Schema Design: Best Practices for Integration and Analysis
What makes for good data analytics? A wealth of data sources, timely and reliable replication to a data warehouse, and, most of all, data organized into a schema that is easy for analysts to access and use. Fivetran focuses on the data pipeline, but we’ve worked with a multitude of customers with different use cases, and we’ve learned some lessons about database schema design best practices.
What Is a Database Schema?
Every database can be described by a data model: a picture of all the elements in all the entities represented in the databases. A schema is a document that lays out the logical structure of a database and translates the data model into specific tables, columns, keys and interrelations.
You can think of the schema as a blueprint for the tables and relations of a data set. It defines the logical database design, and to some extent, depending on the database, the physical design too. Good database schema design is essential to making your data tractable so that you can make sense of it and build the dashboards and reports you need.
Since data warehouses are relational databases, data stored in a data warehouse is described by a schema too. When a data pipeline extracts data from SaaS or database sources and loads it into a data warehouse, it can perform preprocessing, such as cleaning and normalization, to make the data consistent and legible, and then populate the tables described by the schema at the destination.
The Importance of Database Schema Design
A schema organizes data into tables with appropriate attributes, shows the interrelationships between tables and columns, and imposes constraints such as data types. A well-designed schema in a data warehouse makes life easier for analysts by
- removing cleaning and other preprocessing from the analyst’s workflow
- absolving analysts from having to reverse-engineer the underlying data model
- providing analysts with a clear, easily understood starting point for analytics
In other words, a well-designed schema clears the way to faster and easier creation of reports and dashboards.
By contrast, a flawed schema requires data analysts to do extra modeling, and forces every analytics query to take more time and system resources, increasing an organization’s costs and irritating everyone who wants their analytics right away.
In the data analytics world, both data sources and data warehouses use schemas to define data elements. But the schemas for data sources — whether they’re databases such as MySQL, PostgreSQL, or Microsoft SQL Server or SaaS applications such as Salesforce, Facebook Ads, or Zuora — aren’t designed with analytics in mind. The SaaS apps in particular may provide some general analytics functionality, but they cover only the data from that single application. And users don’t get to tweak SaaS schemas — they’re defined by each application’s developers.
Enterprise data is more valuable when it’s replicated to a data warehouse and joined with data from other applications — and organizations do get to design these data structures.
Understanding the Data Model
The first and most important step to leveraging data from an application is to understand the underlying data model. Every SaaS app implicitly contains a representation of the world, inasmuch as the world consists of organizations, people, transactions and other common business concepts. Understanding what data columns correspond to what real-world equivalents is essential to making sense of the data.
When you’re working with an in-house database, chances are you have developers and data engineers who can explain the model. With SaaS applications, you have to rely on the vendor’s documentation and APIs — but the quality of both may be inconsistent. You can get some help from Fivetran’s application documentation pages, many of which contain setup guides for the respective applications.
There are several ways to build an understanding of source data. During schema development at Fivetran, our developers:
- read the documentation
- use the application themselves
- speak with regular users of the application
- speak with the application’s developers
The knowledge that you glean from documentation, your experience using the application and your consultation with the developers should help you understand the application’s business logic and how it represents real-world concepts.
Data Normalization
Once you understand the data model, it’s time to draft the tables and other elements that make up a schema. One tried and true approach for relational database schema design is called normalization. If you’re a database professional, you’re familiar with this process; if you’re not, in a nutshell, normalization strives to eliminate duplicate, redundant and derived data values. Through normalization a database administrator can turn the logical structure of the data model into a schema.
The end result of the normalization process is a database schema definition - a set of tables and columns (also called fields). Some of those fields are key fields, meaning they’re unique and we can build indexes upon them that make it efficient to store and retrieve records. But these tables don’t stand alone — they relate to each other. (That’s why they’re called relational database management systems.) The value of a key field in one table may match the value of a field in another, and by comparing them, we can join the data in the two tables. How do we identify those relationships? This is where an entity-relationship diagram is helpful.
Entity-Relationship Diagrams
Entity-relationship diagrams (ERDs) are visual representations of schemas or entity-relationship models. They represent the interrelations between tables. You can create them by drawing them out, or use one of a host of software tools to create them. Here’s a logical database schema example, showing tables, fields and primary keys.
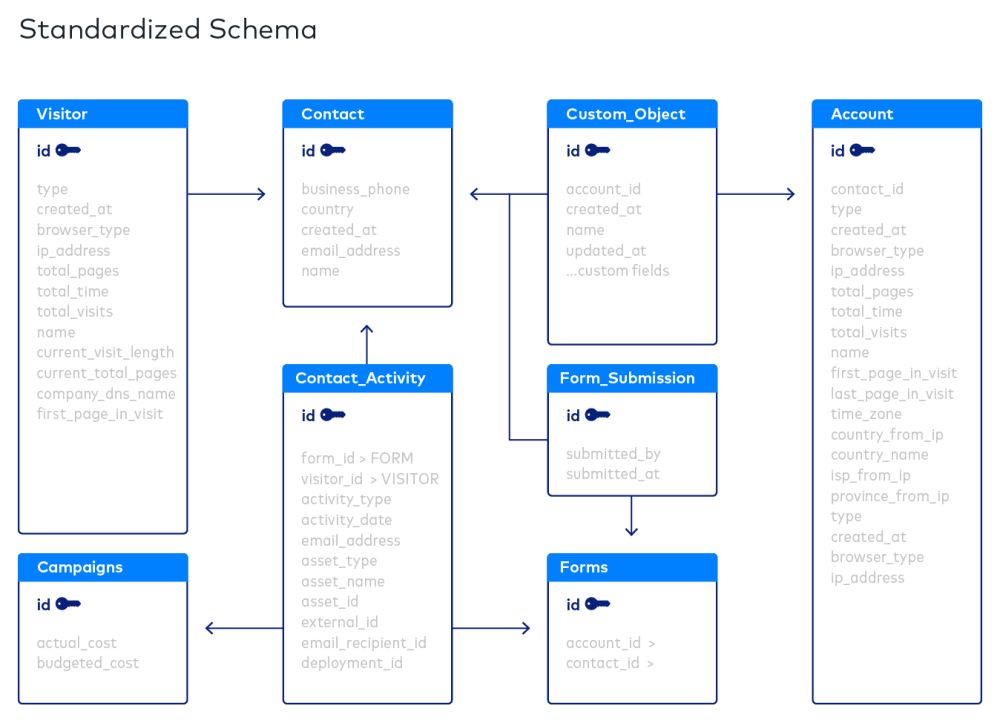
ERDs illustrate the tables, fields, interrelationships and keys between tables
In a normalized database, every table has a primary key that denotes the basic entity that the table represents and uniquely identifies each row in that table. For example, in a customer table, the primary key is likely a customer ID, and the table would contain information such as a customer’s name, address, credit card number, and so on. Some of the columns in each record are what we call foreign keys — that is, they match primary keys from other tables. For example, an employee record would contain as a foreign key an employee’s Social Security number; that number would be the primary key on an employee earnings table.
The two kinds of keys connect the entity represented by the primary key with another entity represented in another table. Key fields are represented by special symbols in the ERD.
Using primary and foreign keys, we can represent three types of relationships:
One-to-one. Two entities can only map onto each other and no other elements. A real-world example would be Social Security numbers, which only ever map onto one person. In Fivetran ERDs, if we encounter a nested object that has a one-to-one relationship with the main table, we simply flatten its data into columns.

One-to-many. One entity in a table can correspond with multiple records in another table, but not vice versa. An example of one-to-many might be a list of ice cream flavors sold by a company, and the customers who have ordered products that feature them. A food retailer might use that data to determine a customer’s favorite flavor. That business insight can then be used to proactively recommend new ice creams which feature that flavor, as they come to market.
The business value of the one-to-many database is therefore demonstrated: Finding insights around commonalities in user behavior, and the data it generates, and aligning them with actions that drive revenue.
Each flavor can have many customers, but each customer only has a single favorite, which rises above all others. If we encounter a nested object that has a one-to-many relationship to the main table, it is turned into a separate table.

Many-to-many. These relationships are represented in join tables. The composite primary key in a join table consists of the primary keys of the two related entities. For instance, a person’s shopping habits might bring them to many stores, and each store will have many customers.

The ERD of a normalized schema represents the underlying data model in a clear and concise diagram.
We’ve created ERDs in our documentation for all of the data sources Fivetran supports.


.svg)
.svg)
.svg)